JAMA 2020
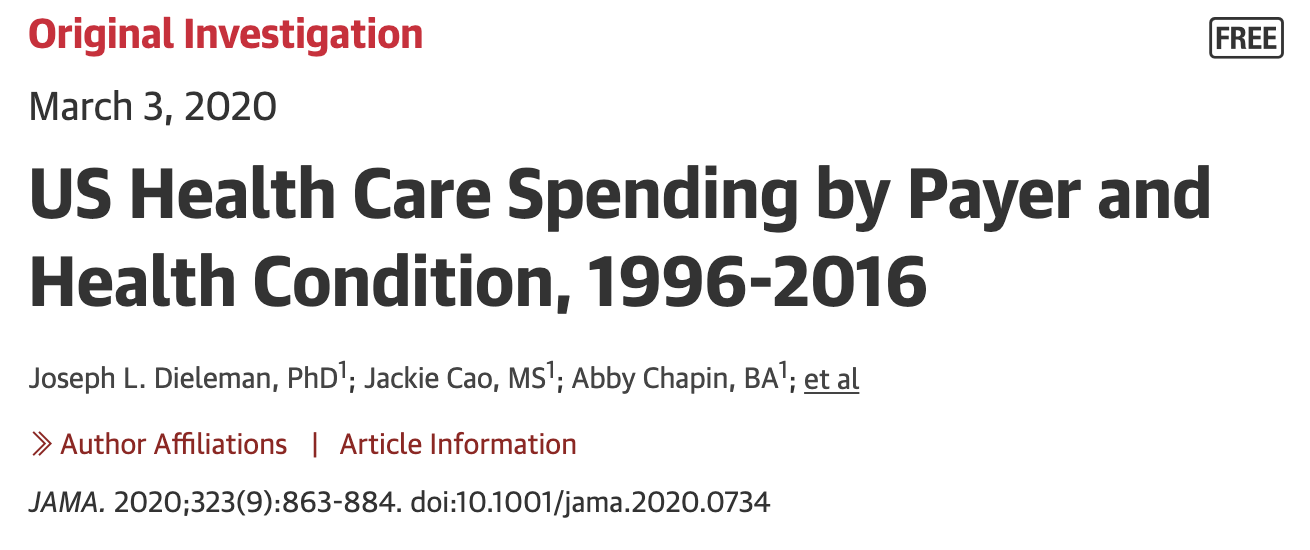
US Health Care Spending by Payer and Health Condition, 1996-2016
Estimates of US spending on health care showed substantial increases from 1996 through 2016, with the highest increases in population-adjusted spending by public insurance. Although spending on low back and neck pain, other musculoskeletal disorders, and diabetes accounted for the highest amounts of spending, the payers and the rates of change in annual spending growth rates varied considerably.
Facebook AI applied research
Creating a data set and a challenge for deepfakes
The goal of the challenge is to produce technology that everyone can use to better detect when AI has been used to alter a video in order to mislead the viewer. The Deepfake Detection Challenge will include a data set and leaderboard, as well as grants and awards, to spur the industry to create new ways of detecting and preventing media manipulated via AI from being used to mislead others.
Diabetes Care 2018
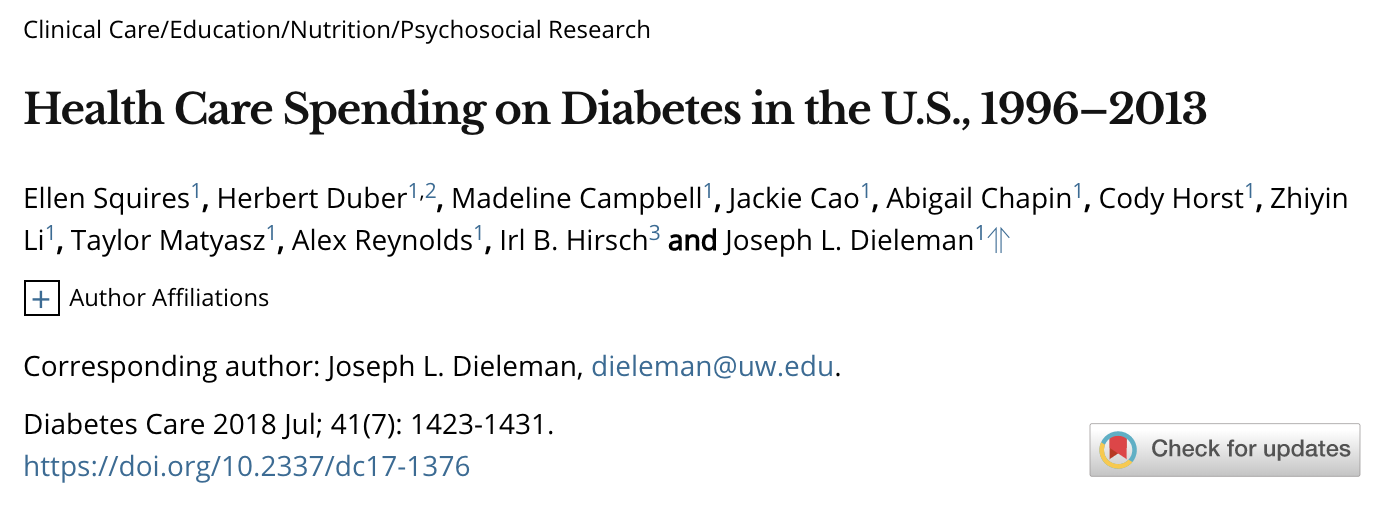
Health Care Spending on Diabetes in the U.S., 1996–2013
Health care spending on diabetes in the U.S. has increased, and spending per encounter has been the biggest driver. This information can help policy makers who are attempting to control future spending on diabetes.
JAMA 2017
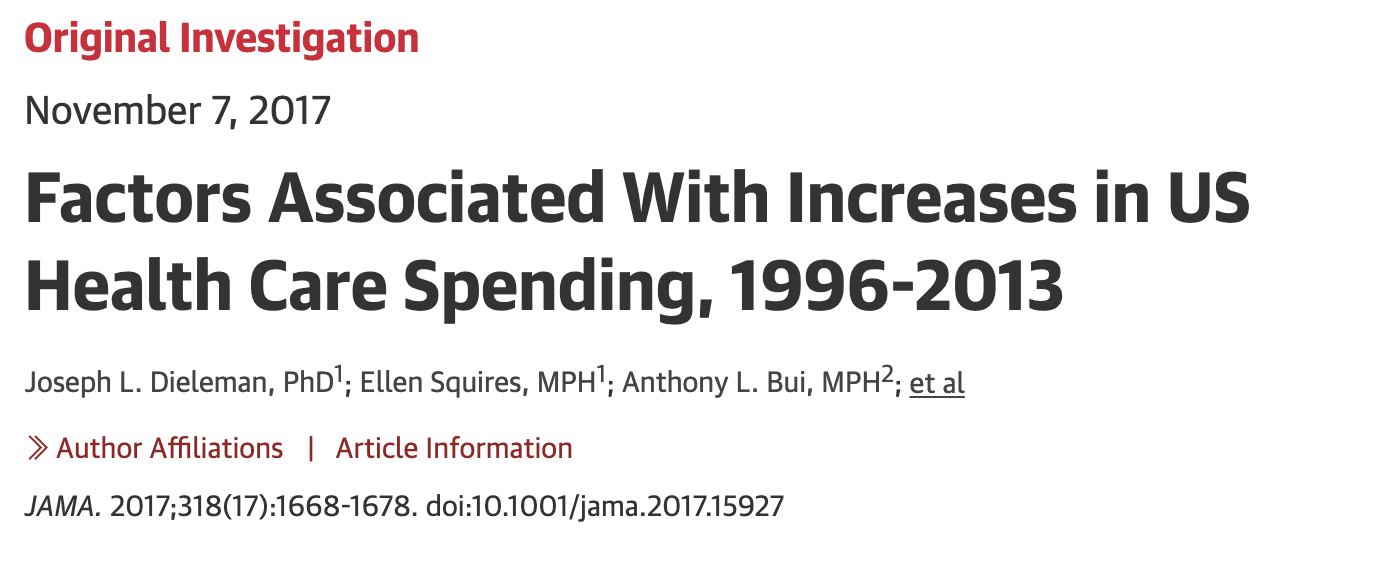
Factors Associated With Increases in US Health Care Spending, 1996-2013
Increases in US health care spending from 1996 through 2013 were largely related to increases in health care service price and intensity but were also positively associated with population growth and aging and negatively associated with disease prevalence or incidence. Understanding these factors and their variability across health conditions and types of care may inform policy efforts to contain health care spending.
Health Economics Review 2017
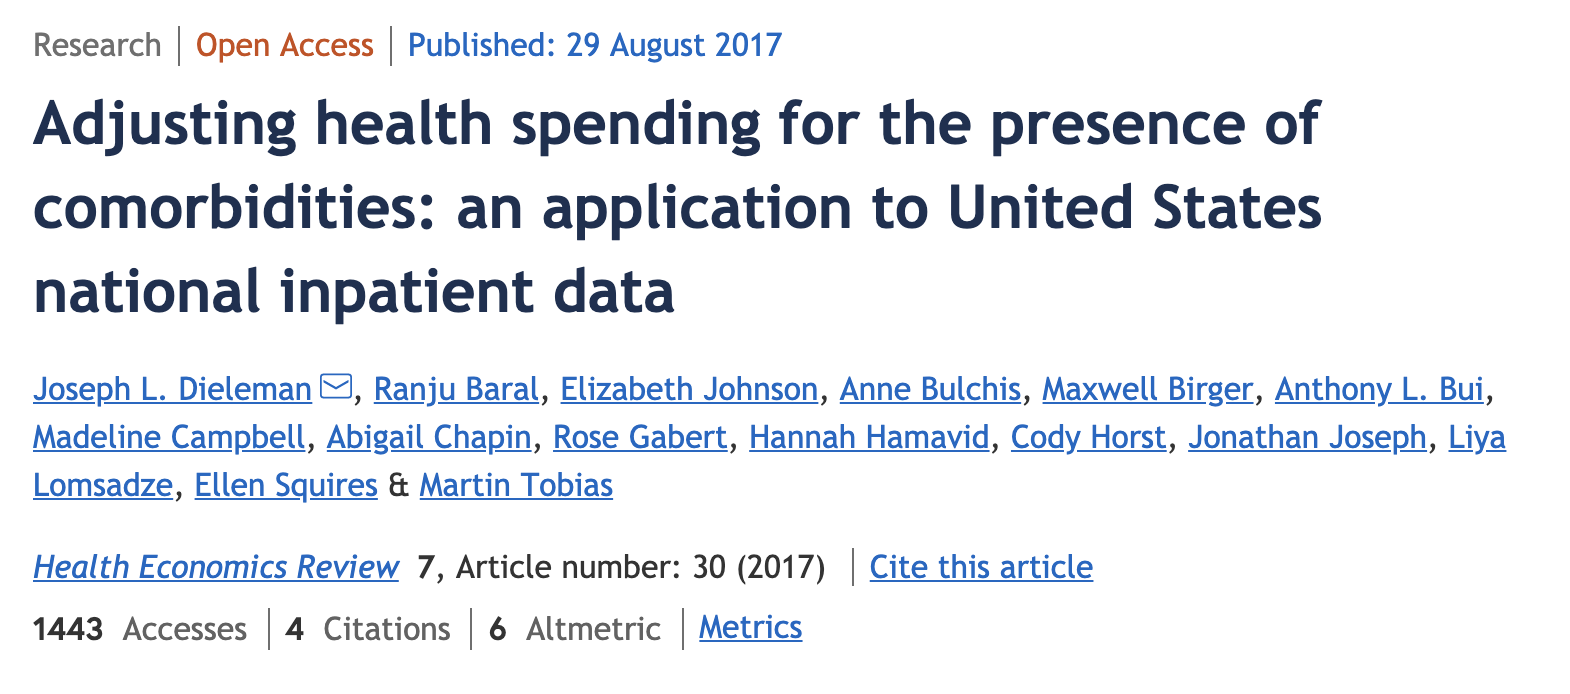
Adjusting health spending for the presence of comorbidities: an application to United States national inpatient data
Our methodology takes a unified approach to account for excess spending caused by the presence of comorbidities. Adjusting for comorbidities provides a substantially altered, more accurate estimate of the spending attributed to specific cause of illness. Making these adjustments supports improved resource tracking, accountability, and planning for future resource allocation.
THE LANCET 2017
Future and potential spending on health 2015–40: development assistance for health, and government, prepaid private, and out-of-pocket health spending in 184 countries
Health spending is associated with economic development but past trends and relationships suggest that spending will remain variable, and low in some low-resource settings. Policy change could lead to increased health spending, although for the poorest countries external support might remain essential.
THE LANCET 2017
Evolution and patterns of global health financing 1995–2014: development assistance for health, and government, prepaid private, and out-of-pocket health spending in 184 countries
Health spending remains disparate, with low-income and lower-middle-income countries increasing spending in absolute terms the least, and relying heavily on OOP spending and development assistance. Moreover, tremendous variation shows that neither time nor economic development guarantee adequate prepaid health resources, which are vital for the pursuit of universal health coverage.
JAMA 2016
US Spending on Personal Health Care and Public Health, 1996-2013
Modeled estimates of US spending on personal health care and public health showed substantial increases from 1996 through 2013; with spending on diabetes, ischemic heart disease, and low back and neck pain accounting for the highest amounts of spending by disease category. The rate of change in annual spending varied considerably among different conditions and types of care. This information may have implications for efforts to control US health care spending.
Bansal Lab 2016
Undergraduate research thesis: Livestock disease models driven by imperfect spatial data
This project aims to determine the effect of decreasing the spatial detail of cattle movement data on predicted epidemic size. The data for our study, provided by the UK Department for the Environment, Food and Rural Affairs (DEFRA), represents a complete record of all movements to be subsampled at varying degrees of geographic resolution. Epidemics on the resulting network representations were modeled using a stochastic, discrete-time, susceptible, infected, recovered (SIR) disease model, parameterized as in prior analyses of the UK 2001 foot-and-mouth epidemic and other cattle diseases.
Full text provided upon request.
This list is incomplete! Shoot me an email to talk in more detail 😊
Want to grab ☕ or 🍺?
I'm always down to talk data, stats or politics.
(pitch me a story!)
